Mọi kiến thức về PMI-PBA
Bài viết Mọi kiến thức về PMI-PBA® bao gồm Danh sách các từ khoá/thuật ngữ quan trọng mà Atoha tổng hợp nhằm giúp học viên vượt qua kỳ thi PMI-PBA® dễ dàng.
Session 1. INTRODUCTION
Business analysis is the application of knowledge, skills, tools, and techniques to:
- Determine problems and identify business needs;
- Identify and recommend viable solutions for meeting those needs;
- Elicit, document, and manage stakeholder requirements in order to meet business and project objectives;
- Facilitate the successful implementation of the product, service, or end result of the program or project
In short, business analysis is the set of activities performed to identify business needs and recommend relevant solutions; and to elicit, document, and manage requirements.
Requirement is “a condition or capability that is required to be present in a product, service, or result to satisfy a contract or other formally imposed specification.”
A requirement represents something that can be met by a product or service, and can address a need of the business, person, or group of people. A requirement should be independent of the design of the solution that addresses it. A requirement may explain a feature that is to be met by a product or software component. When a specific type of requirement is under discussion, the term requirement is preceded by a qualifier such as stakeholder, business, or solution.
The responsibility for defining requirements should be assigned to resources that have sufficient business subject matter expertise and decision-making authority.
The project manager is accountable for ensuring that requirements-related work is accounted for in the project management plan and that requirements-related activities are performed on time and within budget and deliver value.
Requirement Types:
- Business Requirements. Describe the higher-level needs of the organization as a whole, such as business issues or opportunities, and reasons why a project has been undertaken.
- Stakeholder Requirements. Describe the needs of a stakeholder or stakeholder group, where the term stakeholder is used broadly to reflect the role of anyone with a material interest in the outcome of an initiative, and could include customers, suppliers, and partners, as well as internal business roles.
- Solution Requirements. Describe the features, functions, and characteristics of a product, service, or result that will meet the business and stakeholder requirements. Solution requirements are further grouped into functional and nonfunctional requirements.
- Functional Requirements. Describe the behaviors of the product.
- Nonfunctional Requirements. Describe the environmental conditions or qualities required for the product to be effective.
- Transition Requirements. Describe temporary capabilities, such as data conversion and training requirements, and operational changes needed to transition from the current state to the future state.
Project requirements and quality requirements are not part of the business analysis effort:
In business analysis, nonfunctional requirements are often referred to as quality of service requirements. Quality of service requirements are not quality requirements. A quality of service requirement describes a quality of the product while a quality requirement describes a quality characteristic of a project deliverable. To avoid any confusion between quality requirements and quality of service requirements, this practice guide uses the term nonfunctional requirements when referring to the category of requirements that describe product quality conditions.
Section 2 on Needs Assessment (18%)
Section 2 discusses the business analysis work that is conducted to analyze a current business problem or opportunity and to assess the current internal and external environments of the organization for the purpose of understanding what needs to occur in order to attain the desired future state. Some of this work may be undertaken by business analysts before a project is proposed. Section 2 further explains the business analysis tasks to understand the goals and objectives of the organization, define problems and opportunities, assess the current capabilities of an organization, define the desired future state, identify capability gaps, and contribute to the development of a business case for the purposes of proposing viable options that will enable the organization to meet its business objectives. This section presents various techniques for analyzing and assessing the organization as well as valuation techniques for assessing the viability of solution options.
Section 3 on Business Analysis Planning (22%)
Section 3 discusses the work that is conducted in order to define the business analysis approach and plan for the completion of the requirements-related activities necessary to meet the needs of the project. Section 3 discusses the use of stakeholder analysis to complete a thorough assessment of the stakeholders who will be participating in the business analysis efforts and discusses all of the process decisions and planning activities that are recommended for constructing an optimal business analysis plan for the project. Section 3 discusses how the selected project life cycle influences the timing and the approach to business analysis planning and describes how the approach will be different based on the life cycle chosen.
Section 4 on Requirements Elicitation and Analysis (35%)
Section 4 discusses the iterative nature of the work performed to plan, prepare, and conduct requirements elicitation and to analyze and document the results of that work. A number of elicitation and analysis techniques are defined and explained. Examples are included to provide context and describe how to practically apply these techniques on projects. Different forms of requirement documentation choices are discussed and guidelines for writing high-quality requirements are provided. A large percentage of project time is spent on elicitation and analysis; therefore, this section provides a thorough explanation of concepts in order to help practitioners better perform in these areas.
Section 5 on Traceability and Monitoring (15%)
Section 5 covers the comprehensive set of activities for approving requirements and managing changes to requirements throughout the project life cycle. The benefits associated with capturing requirement attributes and building a traceability matrix for a project are discussed. Section 5 provides a formal requirements change process and discusses how changes to requirements are analyzed, assessed, approved, communicated, and managed throughout a project. Baselining requirements, impact analysis, configuration management, and version control are also addressed. Additionally, considerations for a streamlined approach to traceability and monitoring are noted.
Section 6 on Solution Evaluation (10%)
Section 6 discusses the business analysis tasks that are performed to validate a solution that is either implemented or ready to be implemented. This section focuses on both qualitative and quantitative evaluation methods; discusses how evaluation criteria and acceptance levels are used to perform an evaluation of the solution; and discusses work performed to evaluate, analyze, and report on the evaluation results. A number of evaluation techniques are defined and examples are shared to demonstrate the practical application of their use.
Session 2. NEEDS ASSESSMENT (18%)
2.3 Identify Problem or Opportunity: IS IPO GaDa DraAp
- 2.3.1 Identify Stakeholders
- 2.3.2 Investigate the Problem or Opportunity
- 2.3.3 Gather Relevant Data to Evaluate the Situation
- 2.3.4 Draft the Situation Statement
- 2.3.5 Obtain Stakeholder Approval for the Situation Statement
2.4 Assess Current State of the Organization: AOGO.S Cri RoCa ReCap CuGap
- 2.4.1 Assess Organizational Goals and Objectives
- 2.4.1.1 Goals and Objectives
- 2.4.1.2 SMART Goals and Objectives
- 2.4.2 SWOT Analysis
- 2.4.3 Relevant Criteria
- 2.4.4 Perform Root Cause Analysis on the Situation
- 2.4.4.1 Five Whys
- 2.4.4.2 Cause-and-Effect Diagrams: fishbone diagram, interrelationship diagram, process flow,
- 2.4.5 Determine Required Capabilities Needed to Address the Situation
- 2.4.5.1 Capability Table.
- 2.4.5.2 Affinity Diagram
- 2.4.5.3 Benchmarking
- 2.4.6 Assess Current Capabilities of the Organization: process flow, enterprise and business architecture, capability framework.
- 2.4.7 Identify Gaps in Organizational Capabilities
2.5 Recommend Action to Address Business Needs: HA AO CAR FI(OTCTA) VO CBA
- 2.5.1 Include a High-Level Approach for Adding Capabilities
- 2.5.2 Provide Alternative Options for Satisfying the Business Need
- 2.5.3 Identify Constraints, Assumptions, and Risks for Each Option
- 2.5.3.1 Constraints
- 2.5.3.2 Assumptions
- 2.5.3.3 Risks
- 2.5.4. Assess Feasibility and Organizational Impacts of Each Option (OTCTA)
- 2.5.4.1 Operational Feasibility
- 2.5.4.2 Technology/System Feasibility
- 2.5.4.3 Cost-Effectiveness Feasibility
- 2.5.4.4 Time Feasibility
- 2.5.4.5 Assess Factors
- 2.5.5 Recommend the Most Viable Option
- 2.5.5.1 Weighted Ranking
- 2.5.6 Conduct Cost-Benefit Analysis for Recommended Option
- 2.5.6.1 Payback Period (PBP)
- 2.5.6.2 Return on Investment (ROI)
- 2.5.6.3 Internal Rate of Return (IRR)
- 2.5.6.4 Net Present Value (NPV)
2.6 Assemble the Business Case
- Problem/Opportunity; Analysis of the Situation; Recommendation; Evaluation
- 2.6.1 Value of the Business Case
Session 3. BUSINESS ANALYSIS PLANNING (22%)
3.3 Conduct or Refine the Stakeholder Analysis
- 3.3.1 Techniques for Identifying Stakeholders
- 3.3.1.1 Brainstorming
- 3.3.1.2 Organizational Charts
- 3.3.2 Determine Stakeholder Characteristics: ACCE Li La
- 3.3.2.1 Attitude
- 3.3.2.2 Complexity
- 3.3.2.3 Culture
- 3.3.2.4 Experience
- 3.3.2.5 Level of Influence
- 3.3.2.6 Location and Availability
- 3.3.3 Techniques for Grouping or Analyzing Stakeholders
- 3.3.3.1 Job Analysis: descriptive in nature
- 3.3.3.2 Persona Analysis: behavior in nature. A persona simply may be a user who has no influence. Personas describe the goals, behaviors, motivations, environment, demographics, and skills of the user class.
- 3.3.4 Assemble the Stakeholder Analysis Results
3.4 Create the Business Analysis Plan:
LoDe Con LiCy TeTra LL PE PA DeRePri TraAp ComAp DeMa ReVeVa ReCha SoEv:
Lô Đề Con LiCy; TeTra Lắm Lời PE PA; Dê Rẻ Pha Trà Ấp Cơm; DeMa Rờ VeVa; ReChange Sao Ev
- 3.4.1 Business Analysis Plan vs. Requirements Management Plan
- 3.4.2 What to Include in the Business Analysis Plan
- 3.4.2.1 Determining the Proper Level of Detail
- 3.4.3 Understand the Project Context
- 3.4.4 Understand How the Project Life Cycle Influences Planning Decisions
- 3.4.5 Ensure the Team is Trained on the Project Life Cycle
- 3.4.6 Leverage Past Experiences When Planning
- 3.4.6.1 Lessons Learned
- 3.4.6.2 Retrospectives: set the stage, gather data, generate insights, decide what to do, close the retrospective.
- 3.4.7 Plan for Elicitation
- 3.4.7.1 Strategies for Sequencing Elicitation Activities
- 3.4.8 Plan for Analysis
- 3.4.9 Define the Requirements Prioritization Process
- 3.4.10 Define the Traceability Approach
- 3.4.11 Define the Communication Approach
- 3.4.12 Define the Decision-Making Process
- 3.4.13 Define the Requirements Verification and Validation Processes
- 3.4.14 Define the Requirements Change Process
- 3.4.15 Define the Solution Evaluation Process
3.5 Plan the Business Analysis Work: Who Build (DeTaTimS RRRe WorkEs) Assemble; Rat Review App
- 3.5.1 Determine Who Plans the Business Analysis Effort
- 3.5.2 Build the Business Analysis Work Plan (DeTaTimS RRRe WorkEs)
- 3.5.2.1 Identify the Deliverables
- 3.5.2.2 Determine the Tasks and Activities
- 3.5.2.3 Determine the Timing and Sequencing of Tasks
- 3.5.2.4 Determine the Roles and Responsibilities
- 3.5.2.5 Identifying the Resources
- 3.5.2.6 Estimate the Work
- 3.5.3 Assemble the Business Analysis Work Plan
- 3.5.4 Document the Rationale for the Business Analysis Approach
- 3.5.5 Review the Business Analysis Plan with Key Stakeholders
- 3.5.6 Obtain Approval of the Business Analysis Plan
Session 4. REQUIREMENTS ELICITATION AND ANALYSIS (35%)
4.3 Plan for Elicitation
- 4.3.1 Develop the Elicitation Plan: what, where, how, sequencing
- 4.3.1.1 Finding Information (where)
- 4.3.1.2 Techniques for Eliciting Information (how)
- 4.3.1.3 Sequencing the Elicitation Activities (sequencing)
4.4 Prepare for Elicitation: objectives, participants, questions
- 4.4.1. Determine the Objectives
- 4.4.2 Determine the Participants
- 4.4.3 Determine the Questions for the Session
4.5 Conduct Elicitation Activities: introduction, body, close, follow-up
- 4.5.1 Introduction
- 4.5.2 Body
- 4.5.2.1 Types of Questions
- 4.5.2.2 How to Ask the “Right” Questions
- 4.5.2.3 Listening
- 4.5.3 Close
- 4.5.4 Follow-Up
- 4.5.5 Elicitation Techniques
- 4.5.5.1 Brainstorming
- 4.5.5.2 Document Analysis
- 4.5.5.3 Facilitated Workshops
- 4.5.5.4 Focus Groups
- 4.5.5.5 Interviews
- 4.5.5.6 Observation
- 4.5.5.7 Prototyping
- 4.5.5.8 Questionnaires and Surveys
4.6 Document Outputs from Elicitation Activities
4.7 Complete Elicitation
4.8 Elicitation Issues and Challenges
4.9 Analyze Requirements
- 4.9.1 Plan for Analysis
- 4.9.1.1 Analysis Defined
- 4.9.1.2 Thinking Ahead about Analysis
- 4.9.1.3 What to Analyze
4.10 Model and Refine Requirements
- 4.10.1 Description of Models
- 4.10.2 Purpose of Models
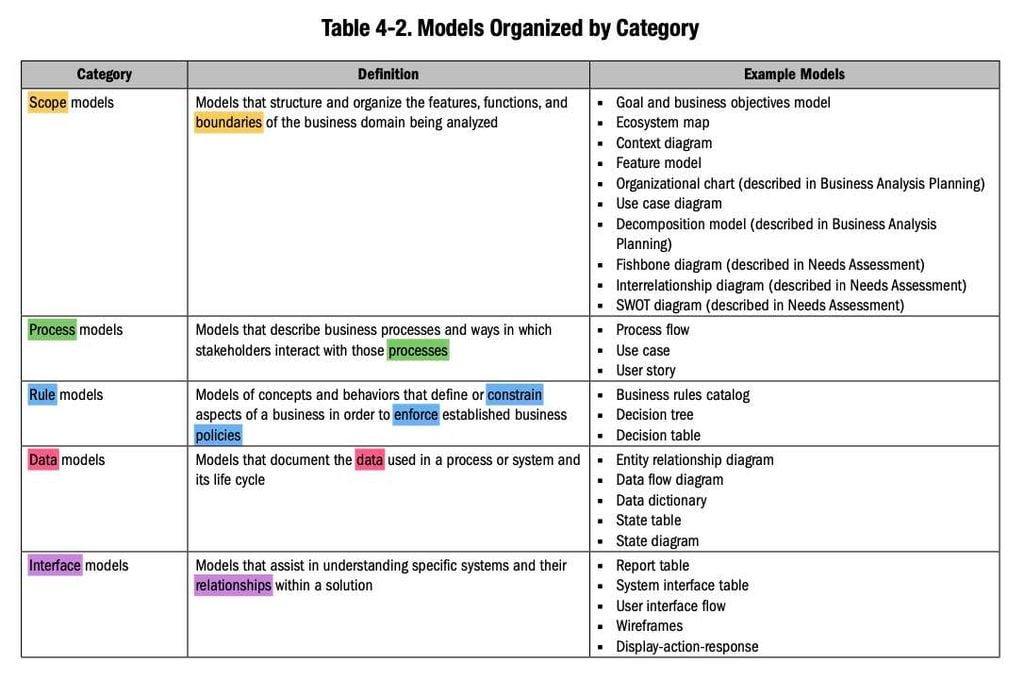
- 4.10.3 Categories of Models
- 4.10.4 Selection of Models: Methodology, Characteristics of the project, Timing within the project life cycle, Categories of models, Level of abstraction
- An agile project will likely use user stories as opposed to use cases.
- A reporting or analytics project will likely use data models, including a data dictionary and report tables.
- A system migration project will probably have scope models such as an ecosystem map or context diagram, as well as data models like a data dictionary and a business rules catalog.
- Early in a project, business analysts usually create context diagrams, ecosystem maps, and high-level process flows.
- Later in a project, business analysts may create state models, decision models, and user interface models.
- A project that involves automating operational functions benefits from process models to elicit information about how work is currently conducted and how work will be performed after the automation is implemented.
- 4.10.5 Use Models to Refine Requirements
- 4.10.6 Modeling Languages
- Business process modeling notation (BPMN)
- Requirements modeling language (RML)
- System modeling language (SysML)
- Unified modeling language (UML)
- Various other modeling languages
- 4.10.7 Scope Models
- 4.10.7.1 Goal Model and Business Objective Model
- 4.10.7.2 Ecosystem Map
- 4.10.7.3 Context Diagram
- 4.10.7.4 Feature Model
- 4.10.7.5 Use Case Diagram
- Organizational chart (described in Business Analysis Planning)
- Decomposition model (described in Business Analysis Planning)
- Fishbone diagram (described in Needs Assessment)
- Interrelationship diagram (described in Needs Assessment)
- SWOT diagram (described in Needs Assessment)
- 4.10.8 Process Models
- 4.10.8.1 Process Flow
- 4.10.8.2 Use Case: name, description, actors, organizational benefit, trigger, preconditions, normal flow, post conditions, alternate flows, exception flows. A use case describes a set of scenarios. A scenario is any single pass through a system to achieve a goal for the primary actor. A use case is a series of activities, actions, and reactions that take the primary actor from initiation to successful completion of the goal.
- 4.10.8.3 User Story. INVEST (Independent, Negotiable, Valuable, Estimable, Small, Testable). A user story is a statement, written from the point of view of the user, and describes the functionality needed in a solution.
- 4.10.9 Rule Models
- 4.10.9.1 Business Rules Catalog
- 4.10.9.2 Decision Tree and Decision Table
- 4.10.10 Data Models
- 4.10.10.1 Entity Relationship Diagram
- 4.10.10.2 Data Flow Diagrams
- 4.10.10.3 Data Dictionary
- 4.10.10.4 State Table and State Diagram
- 4.10.11 Interface Models
- 4.10.11.1 Report Table: name, description, decisions made from the report, objectives, audience, trigger, data fields, data volume, frequency, display format, and calculations
- 4.10.11.2 System Interface Table: source system, target system, volume of data passed, security or other rules, and the actual data objects passed.
- 4.10.11.3 User Interface Flow
- 4.10.11.4 Wireframes and Display-Action-Response
4.11 Document the Solution Requirements
- 4.11.1 Why Documentation is Important
- 4.11.2 Business Requirements Document
- 4.11.3 The Solution Documentation
- 4.11.3.1 Requirements
- 4.11.3.2 Categorization
- 4.11.4 Requirements Specification
- 4.11.4.1 Documenting Assumptions
- 4.11.4.2 Documenting Constraints
- 4.11.5 Guidelines for Writing Requirements
- 4.11.5.1 Functional Requirements: E.g. When the new account button is pressed (condition), the system (subject) will (imperative) display (active verb) the new account entry screen (object) allowing the creation of a new account (outcome).
- Requirements Characteristics: Unambiguous, Precise, Consistent, Correct, Complete, Measurable, Feasible, Traceable, Testable (& Actionable)
- 4.11.6 Prioritizing Requirements
- 4.11.6.1 Prioritization Schemes: MoSCoW, Multivoting, Time-boxing, Weighted ranking
- 4.11.7 Technical Requirements Specification
- 4.11.8 Documenting with Use Cases
- 4.11.9 Documenting with User Stories
- 4.11.10 Backlog Items
4.12 Validate Requirements
- 4.12.1 The Concept of Continual Confirmation
- 4.12.2 Requirements Walkthrough
4.13 Verify Requirements
- 4.13.1 Peer Review
- 4.13.2 Inspection
4.14 Approval Sessions
4.15 Resolve Requirements-Related Conflicts
- 4.15.1 Delphi
- 4.15.2 Multivoting
- 4.15.3 Weighted Ranking
Session 5. TRACEABILITY AND MONITORING (15%)
5.2 Traceability
- 5.2.1 What is Traceability?
- 5.2.2 Benefits of Tracing Requirements
- 5.2.3 The Traceability Matrix
- 5.2.3.1 Requirements Attributes
- 5.2.3.2 Traceability Matrix Hierarchy
5.3 Relationships and Dependencies
- 5.3.1 Subsets
- 5.3.2 Implementation Dependency
- 5.3.3 Benefit or Value Dependency
5.4 Approving Requirements
- 5.4.1 Work Authorization System
- 5.4.2 Approval Levels
5.5 Baselining Approved Requirements
- 5.5.1 What is a Requirements Baseline?
- 5.5.2 Relationship of Requirements Baseline, Product Scope, and Project Scope
- 5.5.3 Maintaining the Product Backlog
5.6 Monitoring Requirements Using a Traceability Matrix
- 5.6.1 Benefits of Using Traceability to Monitor Requirements
5.7 The Requirements Life Cycle
5.8 Managing Changes to Requirements
- 5.8.1 Change Management as it Relates to Business Analysis
- 5.8.2 Change Control Tools and Techniques
- 5.8.2.1 Configuration Management System (CMS)
- 5.8.2.2 Version Control System (VCS)
- 5.8.3 Impact Analysis
- 5.8.3.1 Impact on the Requirements Baseline
- 5.8.3.2 Impact on whether a Proposed Change Conflicts with Other Requirements
- 5.8.3.3 Impact on Business Analysis
- 5.8.3.4 Impact on Project Management
- 5.8.3.5 Recommending a Course of Action
- 5.8.4 Controlling Changes Related to Defects
Session 6. SOLUTION EVALUATION (10%)
6.3 Recommended Mindset for Evaluation
- 6.3.1 Evaluate Early and Often
- 6.3.2 Treat Requirements Analysis, Traceability, Testing, and Evaluation as Complementary Activities
- 6.3.3 Evaluate with the Context of Usage and Value in Mind
- 6.3.4 Confirm Expected Values for Software Solutions
6.4 Plan for Evaluation of the Solution
6.5 Determine What to Evaluate
- 6.5.1 Consider the Business Goals and Objectives
- 6.5.2 Consider Key Performance Indicators
- 6.5.3 Consider Additional Evaluation Metrics and Evaluation Acceptance Criteria
- 6.5.3.1 Project Metrics as Input to the Evaluation of the Solution
- 6.5.3.2 Customer Metrics
- 6.5.3.3 Sales and Marketing Metrics
- 6.5.3.4 Operational Metrics and Assessments
- 6.5.3.5 Functionality
- 6.5.4 Confirm that the Organization Can Continue with Evaluation
6.6 When and How to Validate Solution Results
- 6.6.1 Surveys and Focus Groups
- 6.6.2 Results from Exploratory Testing and User Acceptance Testing
- 6.6.3 Results from Day-in-the-Life (DITL) Testing
- 6.6.4 Results from Integration Testing
- 6.6.5 Expected vs. Actual Results for Functionality
- 6.6.6 Expected vs. Actual Results for Nonfunctional Requirements
- 6.6.7 Outcome Measurements and Financial Calculation of Benefits
6.7 Evaluate Acceptance Criteria and Address Defects
- 6.7.1 Comparison of Expected vs. Actual Results
- 6.7.2 Examine Tolerance Ranges and Exact Numbers
- 6.7.3 Log and Address Defects
6.8 Facilitate the Go/No-Go Decision
6.9 Obtain Signoff of the Solution
6.10 Evaluate the Long-Term Performance of the Solution
- 6.10.1 Determine Metrics
- 6.10.2 Obtain Metrics/Measure Performance
- 6.10.3 Analyze Results
- 6.10.4 Assess Limitations of the Solution and Organization
- 6.10.5 Recommend Approach to Improve Solution Performance
6.11 Solution Replacement/Phase out
Session 7. Others
- Understanding the business need (problem or opportunity) is the first step in every business analysis assignment. Without understanding the need, it will be difficult to identify stakeholders, study the right current state processes, or draft a situation statement.
- COTS is an acronym for Commercial Off-the Shelf, and is used in reference to software packages.
- CRUD matrix. CRUD, defined as create (C), read (R), update (U), and delete (D), represents the operations that can be applied to data or objects. CRUD matrices describe who or what has permission to perform each of the CRUD operations on elements, such as data or user interface screens.
- Solution capability matrix is a model that provides a simple visual way to examine capabilities and solution components in one view, identifying where capabilities will be addressed in the new solution.
- Real options: 2 fundamental principles are applied to decision making with real options:
- The first is to reduce the number of decisions that need to be made in the short term.
- The second is to delay all decision making until as late as possible.
- Product visioning is a technique used to set the high-level direction for a product or a product release. It entails conducting conversations with team members to visualize and obtain agreement about what the team envisions for the product. Product visioning is performed by using one more elicitation techniques, such as collaborative games. It typically results in the development of a written or visual deliverable to ensure a shared understanding of the product and its direction - for example, a vision statement or a product box.
- Kano analysis: is a technique used to model and analyze product features by considering the features from the viewpoint of the customer. Kano analysis can be used to help a product team understand the level of importance of features being considered for the future state. The vertical axis is used to measure the degree of customer satisfaction that the feature will provide, and the horizontal axis shows how well the product is expected to satisfy or deliver the feature. => Basic, Performance, Delighters, Indifferent, Reverse
- Product glossary: In business analysis, a glossary provides a list of definitions for terms and acronyms about a product. When developing a charter, a glossary can provide a common vocabulary about terms with which the stakeholders and product team are unfamiliar or that are commonly misunderstood, focusing specifically on the terms requiring clarity to understand the information in the charter. If the product team is sharing a glossary across the portfolio, program, or project, a link to the shared glossary can be provided from the charter or team workspace.
- Business rules catalog is a table of business rules and related attributes. Common attributes to capture in a business rules catalog include a unique ID for the business rule, the rule description, and the type of business rule (there are multiple types of business rule classifications that can be followed), and references to other related documents. Business rules themselves are not processes or procedures, but rather describe how to constrain or support a behavior
- A product life cycle may consist of multiple project life cycles.
- Requirements attributes - CAWADO'S SOUPS PSVD:
- Complexity, Absolute reference (ID), WBS, Acceptance criteria, Description, Objectives
- Source, Stability, Owner, Urgency (Rationale), Priority, Status.
- Product Development, Stakeholder satisfaction, Version, Date completed
- Velocity. A measure of a team’s productivity rate at which the deliverables are produced, validated, and accepted within a predefined interval. Velocity is a capacity planning approach frequently used to forecast future project work.
- Adaptive projects rarely have a BA plan.
- Facilitated workshops may be used more when stakeholders are located in close physical proximity, as opposed to surveys or interviews which may work better across time zones and with geographically dispersed stakeholders.
- Reason to use an onion diagram when analyzing stakeholders: to model stakeholders and their relationships to the solution.
- Estimation techniques: Affinity estimating (T-shirt sizing), Bottom-up estimating, Delphi, Estimation poker, Relative estimation, Wide-band Delphi
- product requirements describe what is being built or the outcome of the project or solution to the business problem, project requirements describe the constraints and necessities for successful completion of the project.
Issue
- Issue. A current condition or situation that may have an impact on the project objectives.
- Issue. A point or matter in question or in dispute, or a point or matter that is not settled and is under discussion or over which there are opposing views or disagreements.
Note: “Issue” in BA Glossary is different from “issue” definition in PMP !
- Interaction matrix is a lightweight version of a traceability matrix that is used to figure out whether requirements are sufficiently detailed or if any entities are missing. The main difference between the two types of traceability matrices is that an interaction matrix represents a specific point in time. As a result, interaction matrices are not maintained and are simply used to evaluate requirements at any given time during a project.
- Requirements Characteristics: Unambiguous, Precise, Actionable, Consistent, Correct, Complete, Measurable, Feasible, Traceable, Testable
- Configuration management system (CMS) helps ensure that the solution being built conforms to its approved product information.
- Version control system (VCS) tracks the history of revisions of any type of work product. A VCS falls under the umbrella of a CMS and is one of the many functions that comprise configuration management.
- Story slicing is a technique used to split requirements or user stories from a higher level to a lower level. Story slicing is a means of establishing relationships between requirements as lower-level requirements or user stories are subsets of higher-level requirements or epics.
- Story mapping is a technique used to sequence user stories, based upon their business value and the order in which their users typically perform them, so that teams can arrive at a shared understanding of what will be built. Horizontally, the story map shows what will be delivered within an iteration, and vertically the story map depicts higher-level groupings or categories of user stories. User stories may be grouped by different categories such as functionality, themes, or application. Story mapping can be used to establish relationships between user stories to iterations and the higher-level categories.
- Force field analysis: identifies the pros and cons of a decision or change.
- Validate the solution's test results, reports, and other test evidence against the requirements acceptance criteria in order to determine whether the solution satisfies the requirements.
- Evaluate the deployed solution using valuation techniques in order to determine how well the solution meets the business case and value proposition.
- Many roles can participate in determining the solution evaluation approach.
- Any manager whose area could be responsible for collecting, monitoring, evaluating, or funding the costs to obtain the performance data could participate in determining and approving the approach.
- Risk compliance and legal areas may provide requirements as to what needs to be measured, for how long, and for what length of time performance data need to be retained.
- Project sponsors also need to be included because they hold different insights as funders and may have different priorities in terms of what they are willing to spend for Solution Evaluation.
- Operational leads may provide ideas for metrics and assess the ability of their operational areas to measure them and provide insights into the costs associated with collecting them.
- Prototype: A few common kinds of prototypes are the following:
- Storyboarding. A prototyping technique that shows sequence or navigation through a series of images or illustrations.
- Wireframes. Diagrams that represent a static blueprint or schematic of a user interface used to identify basic functionality.
- Evolutionary. A prototype that is the actual finished solution in process.
- User Story. A one or two sentence description written from the viewpoint of the actor that describes a function that is needed. A user story usually takes the form of “as an <actor>, I want to <function>, so that I can <benefit>.”
- Business analyst selects the appropriate types of questions to meet the objectives and to mix up the question types in order to generate the most information.
- Negotiation. The process and activities used to resolve disputes through consultations between involved parties.
- Expert judgment is composed of
- enterprise/organizational knowledge,
- business acumen,
- industry knowledge,
- life cycle knowledge,
- political and cultural awareness,
- product knowledge, and
- standards.
- Enterprise architecture is a collection of business and technology components needed to operate an enterprise. Enterprise architecture is assembled in the form of a schematic or model. Models can be analyzed to understand the strategic and operational impacts that a change will have on various aspects of the enterprise.
- Business architecture is a subset of the enterprise architecture and contains components such as the business functions, organizational structures, locations, and processes of an organization, including documents and depictions of those elements.
- Requirements architecture will be used to specify how requirements, models, and other product information will be related to one another, including which components of product information will be most appropriate to trace to and how they will be traced to one another.
Purpose alignment model
- At the project level, product features are placed on a quadrant matrix considering two factors:
- criticality
- market differentiation
- A product feature that is determined to be highly critical may be needed for the organization to stay in business or meet regulations. A product feature rated as a market differentiator may contribute to the organization’s ability to gain market share, increase sales, or surpass competitor offerings. The discussions a product team works through when determining how best to position the feature on the grid promotes a shared understanding about value. The analysis provides information to help determine which features the organization should invest in.
- Purpose alignment model: differentiating, parity, partner, or who cares
- Product backlog DEEP: Detailed appropriately, Estimated, Emergent, Prioritized
- ERDs helps identify any processes that might create, consume, or manipulate the data, as well as business rules about the data. When used alongside process models, ERDs can be used to model the data of importance from a process perspective.
- Business capability analysis is a technique used to analyze performance in terms of processes, people skills, and other resources used by an organization to perform its work
- Business goals and objectives align to the organizational goals and objectives, but are at a lower level because they specify stated targets that the business is seeking to achieve.
- Stakeholder interests and influences as related to expected solution value; performed during initial planning or early iterations and can be revisited prior to the start of an iteration when specific details regarding stakeholders are required for the next iteration.
- High-level vision of the solution and an early version of product scope might be created. Initial solution options are evaluated during iteration 0. Tasks can be created as “spikes” to investigate the feasibility of a solution during an iteration.
- A product is an artifact that is produced, is quantifiable, and can be either an end item in itself or a component item.
- Iteration 0: in agile
- Assess Current State
- Determine Future State
- Determine Viable Options and Provide Recommendation
- Conduct BA Planning
- Prepare for Elicitation
- Identify and Analyze Product Risks
- Determine Traceability and Monitoring Approach
- The business need defines the reason for a change, and the objective identifies what the business expects to be delivered
- Stakeholder maps are a collection of techniques used for analyzing how stakeholders relate to one another and to the solution under analysis. Several stakeholder mapping techniques exist. The stakeholder matrix and onion diagram are just two of these.
- underlying rationale for the initiative => Business requirements are goals, objectives, and higher-level needs of the organization that provide the rationale for why a project is being undertaken. Business requirements are defined before a solution is determined and recognize what is critical to the business and why
- A verbal agreement on the format and level of detail on an adaptive project. And most communication will be in person when team members are collocated
- Work products are not required and are not tracked as part of the plan. Deliverables are required and usually have an approved format the BA is required to use.
- For solutions developed using an adaptive approach, a lack of stability can be a particularly valuable indicator. While changes are expected and embraced during an adaptive life cycle, there is an expectation that stability will increase as the project proceeds. Other metrics for adaptive projects to consider include the number of open issues/ questions about user stories or the percentage of stories ready for development, based on the agreed-upon definition of ready, in time for iteration planning.
- Stakeholder matrix: Influence vs. Impact
- Influence. How much the stakeholder may influence product requirements, and
- Impact. How significantly the solution will impact the stakeholder once it is implemented.
- Transition activities require a degree of rigor and discipline to ensure a smooth transition in both predictive and adaptive environments.
- In Adaptive the Approach: Stakeholders are identified during initial planning, often using brainstorming, and can be revisited at any point throughout the adaptive life cycle as stakeholders are discovered. Deliverable: Might be a list of stakeholders noted in lightweight documentation or models may just involve brainstorm results.
- You are working on the development of your business analysis plan and are looking forward to getting input from others => The project team and others involved in business analysis activities.
- Estimates of the effort that is going to be needed for BA activities on a project => Business analysis plan
Requirements package
- Requirements package: The total culmination of all product information forms what is called a requirements package.
- Requirements package does not have to be, and often is not, a formal document. It could be user stories and related information stored and evolving in a backlog.
- Requirements package could also include requirements and related information stored in a requirements management tool or other repository.
- The formality and level of detail in the requirements package is defined by the project life cycle and what the stakeholders need to perform their tasks, both of which are determined during planning activities.
- Requirements package is the product information used to communication about the solution at a point in time
- The business analyst prepares the requirements package so that the solution team understands how to develop the solution. Documentation can be produced in various levels of formality and in many forms, and is often dependent on the selected project life cycle. The solution may not be the complete solution, as in the case of a project following an adaptive project life cycle, but it should represent the solution based on the information available at that point in time.
- The approach to communicating product-related information on an adaptive project is typically described in which of the following? => A verbal agreement on the format and level of detail.
- Work products: Agendas, meeting minutes, parking lot lists, and some types of models, although necessary to organize work and perform effectively, are not required to be produced and, therefore, are not considered a business analysis deliverable. These items are often referred to as work products and are created in order to perform the work, but are not a promised deliverable that will be tracked and managed through the project management plan. During planning, the business analyst should think about the work products and how they will be created, stored, accessed, and used by the project team. Planning for work products is much less formal than deliverables.
- Deliverables, on the other hand, are required and often impact the work of individuals who perform activities later on in the project life cycle. These documents are usually formatted for consistency across projects and often have an approved structure or template that the business analyst is required to use. Examples of these include, but are not limited to: a high-level requirements document, software requirements specification, user stories, business rules catalog, and a nonfunctional requirements list. While planning the deliverables for the project, the business analyst considers what types of requirements will be collected and the different deliverable formats that are required to be used. Additionally, consideration is given to stakeholder requests for receiving specific types of documentation or obtaining information in certain formats or tools. The selected project life cycle heavily influences which deliverables will be produced as do the size and complexity of the project.
- Brainstorming can produce creative ideas quickly in many instances and at many points in a project.
- Business value, cost, regulations, technical risks and difficulty are factors analyzed for: Requirements prioritization.
- Typical format for defining acceptance criteria for user stories on adaptive projects => Given-When-Then: Given <precondition(s)>, when <action>, then <post conditions>
- To accomplish the goal of developing a use case diagram: List of users and scenarios. Yes, as part of the session you will identify the users and possible scenarios of how they will use the system.
- Tool will you suggest using to help prioritize the portfolio components? => Business objectives model.
- A goal model and business objectives model are scope models that organize and reflect the goals and business objectives in relation to other product information. Goal models typically show the stakeholder goals for a solution, with any supporting or conflicting goal relationships indicated. Business objectives models relate the business problems, business objectives, and top-level features. Goal models and business objectives models are typically created at the start of a new program or project or earlier to help prioritize programs and projects within a portfolio. They can be created at any point, for prioritization purposes.
Use cases:
- Use cases don't document interaction between actors but document the interaction between actors and the system.
- Use cases show the steps that actors and the system take to accomplish a goal. They are used to document process requirements that involve a system.
- Use cases are used when there are complex back and forth interactions between users and systems. These can be used during elicitation sessions to discover and describe complex interactions. Use cases are used during analysis and then later reviewed with stakeholders. Similar to process flows, use cases offer context for a scenario and specifically show how stakeholders envision the solution. Use cases are helpful as a starting point for creating tests, including user acceptance tests. Use cases can be built and implemented iteratively. A use case diagram is not required when creating use cases, but it is a quick way to visually depict which actors are associated with multiple use cases and what the full scope of a use case is. See Section 4.10.7.5 for further information on use case diagrams.
- Use cases describes a customer's interaction with a proposed system to accomplish a goal
- The business analyst may organize the questions with easy, nonthreatening questions at the beginning and end, with the more challenging, complex, or contentious questions in the middle of the session. Doing so helps the group make progress in the session early before needing to address the challenging questions, as well as ensuring the session ends on a positive note.
- Quality requirement is “a condition or capability that will be used to assess conformance by validating the acceptability of an attribute for the quality of a result.”
- Context diagram is a scope model that shows all the direct system and human interfaces to systems within a solution. A context diagram clearly depicts the in-scope systems and any inputs or outputs, including the systems or actors providing or receiving them.
- Storyboarding is a prototyping technique showing sequence or navigation through a series of images or illustrations. In software development, storyboards use mockups to show navigation paths through webpages, screens, or other user interfaces. Storyboards are graphical representations that represent the sequence of events.
- Storyboards are typically static and thrown away. Prototypes focus on what the product will look and feel like, while storyboards focus on the experience.
- Verify requirements in adaptive: User stories and acceptance criteria are checked against the INVEST criteria and any internal or external standards prior to pulling a user story into an iteration. Models can also be verified. The process is performed incrementally, just in time for each user story to be built. Deliverables: Refined user stories are updated in the backlog.
- Validate requirements in adaptive: User stories and acceptance criteria are reviewed in real time with the business stakeholders or during backlog refinement and traced back to the business goals. Models are also validated. This is a continuous activity, because any user stories that are no longer valid should be removed from the product backlog immediately. Deliverables: Refined user stories are updated in the backlog.
- Weighted shortest job first (WSJF). A method used primarily in adaptive frameworks to rank user stories based on more dimensions than just business value and effort. WSJF works by having business value, time criticality, risk reduction or opportunity enablement, and effort all sized using something similar to a Fibonacci sequence used in estimation poker. A formula is used to calculate a weighted value for each user story:
WSJF = [business value + time criticality + (risk reduction/opportunity enablement)] / effort
- Considerations for allocating requirements to solution components: Available resources, constraints on the solution, and dependencies between requirements.
- Allocate accepted or deferred requirements by balancing scope schedule, budget, and resource constraints with the value proposition using prioritization, dependency analysis, and decision-making tools and techniques in order to create a requirements baseline.
- Things you can do prior to a facilitated workshop to enhance the effectiveness of the session: Conduct pre-workshop interviews or meetings. They focus on ensuring that the purpose of the requirements workshop is understood and aligned with the needs of each attendee and ensure that any preparation needed for the session by that attendee is understood
- Process models describe the user or stakeholder elements of a solution, process, or project.
- Process flow
- Use case
- User story
- Interface models depict the relationships within a solution to gain an understanding of which interfaces there are and the details of those interfaces.
- To understand how a solution will be integrated into the current environment => Interface modeling. These help understand how the solution interacts with other systems.
Prototyping
- Prototyping helps visually uncovering interface requirements quickly and early in the analysis process. Because prototypes are tangible, stakeholders are able to visualize and possibly experiment with a model of the product rather than discussing abstract representations of the requirements.
- Storyboarding. A prototyping technique that shows sequence or navigation through a series of images or illustrations.
- Wireframes. Diagrams that represent a static blueprint or schematic of a user interface used to identify basic functionality.
- Evolutionary. A prototype that is the actual finished solution in process.
- Closed-ended questions are good for creating quantifiable data in survey.
- Discussions about product risk occur in iteration 0, when planning work for an iteration, during daily stand-ups to understand immediate risks impacting the solution, and when prioritizing user stories as risks can impact which stories we tackle first. By the time we have a form of the working solution, we would expect that risk discussions have already been occurring.
Traceability
- Traceability involves documenting requirement relationships and is used in business analysis to maintain product scope. When a traceability approach is defined and adhered to, requirement relationships are created, which allow the project team to
- trace backwards to identify the origin of a requirement,
- trace forward to identify how the requirement was tested and implemented, or
- trace in-between requirements to provide insight into the value a group of related requirements can deliver.
- Requirements that are documented but fail to trace to a business need are considered out of scope. Requirements that fail to trace to a solution component identify areas where the product is not in compliance with the requirements.
- When sufficient traceability is established, it is much easier for the project team to understand how a proposed change will impact the project. Those requirements affected by a change can be evaluated to understand how a change in that requirement impacts
- (a) the related project components already built to satisfy the requirement or
- (b) test cases already created to test the feature, etc.
- A sufficient amount of traceability ensures that the impacts of requirements change are properly assessed and quantified from a risk, cost, and time perspective.
- During planning, the business analyst should determine what level of traceability is going to be performed on the project. Higher-risk or more complex projects may require more traceability. Understanding the project context, the type of project, and any organizational process or compliance standards that are required, the business analyst then documents the traceability approach in the business analysis plan.
- Traceability can be started as soon as the first requirement is defined and detailed, because the requirements are progressively elaborated, allowing for the incremental development of the requirements.
- The traceability matrix contains information on the relationships and dependencies between requirements and other product information. The components of product information that are impacted by the change can be easily identified within a traceability matrix. The affected relationships are easily recognized and can be used to quickly and roughly quantify the size and complexity of the change.
- In adaptive approaches, formal traceability matrices are rarely used or named as such, but the concept of tracing to understand impacts to things that are already built still applies.
- Traceability matrix is created, maintained and utilized throughout the project. Interaction matrix is a lightweight version of a traceability matrix intended to be used to assess things at a specific point in time.
- Traceability is the ability to track information across the product lifecycle by establishing connections between objects. Monitoring is ensuring the accuracy of product information from approval through implementation.
- Traceability enables the discovery of missing and extraneous requirements. There is a need to track and monitor completed requirements, no matter what type of life cycle is used for a project or what type of format is used to document the requirements.
- Traceability should be maintained, at a minimum, for the entire duration of the project, even when someone with a business analysis role is no longer associated with the project.
- Portfolio, program, and project managers may contribute to the development of the traceability and monitoring approach to ensure that it is appropriately sized and does not incur unnecessary cost or risk by being over- or underperformed for the needs of the product and portfolio, program, or project. The project manager will be interested in ensuring that the approach for traceability and monitoring is aligned with the tasks, resources, and level of effort specified for this work in the project management plan.
- The kind of thinking inherent in Traceability and Monitoring applies to all projects and all life cycles. Thinking about the relationships between requirements and their relationships to other project considerations, such as tests and releases, is critical for ensuring project consistency and completeness.
- Traceability principles that enable change impact analysis are the basis for confirming the fulfillment of objectives and ensuring test coverage. Traceability enables the discovery of missing and extraneous requirements. There is a need to track and monitor completed requirements, no matter what type of life cycle is used for a project or what format is used to document the requirements.
Entity relationship diagram (ERD)
- ERDs (business data diagram) is a data model that might be used to identify business rules about data.
- An entity relationship diagram (ERD), also called a business data diagram, is a data model that shows the business data objects or pieces of information of interest in a product and the cardinality relationship between those objects. Cardinality is the number of times that one entity occurs in relationship to the other entity in the relationship, and whether the relationship is required or optional. The data objects shown in an ERD are not meant to be exact data objects in a database, but rather a conceptual view of the data in the solution from the perspective of the business. The entity relationship diagram helps identify the data that are created in, consumed by, or output from a system. When used alongside process models, ERDs can be used to model the data of importance from a process perspective.
- ERDs are typically created relatively early in analysis to understand the scope of the data to be analyzed. This model also helps identify any processes that might create, consume, or manipulate the data, as well as business rules about the data. ERDs are also a likely input for database designers and architects to use in database design.
4.10.4 Selection of Models: Methodology, Characteristics of the project, Timing within the project life cycle, Categories of models, Level of abstraction
- An agile project will likely use user stories as opposed to use cases.
- A reporting or analytics project will likely use data models, including a data dictionary and report tables (interface model).
- A system migration project will probably have scope models such as an ecosystem map or context diagram, as well as data models like a data dictionary and a business rules catalog (rule model).
- Early in a project, business analysts usually create context diagrams, ecosystem maps (scope model), and high-level process flows (process model).
- Later in a project, business analysts may create state models (data model), decision models (rule model), and user interface models (interface model).
- A project that involves automating operational functions benefits from process models to elicit information about how work is currently conducted and how work will be performed after the automation is implemented.
Process Flows
- Process flows are in the process model category and are used to visually document the steps or tasks that people perform in their jobs or when they interact with a solution. Typically, process flows describe the steps that people take, although they may describe system steps and could be called system flows. Other names for process flows are swim lane diagrams, process maps, process diagrams, or process flow charts. Process flows can be organized into multiple levels, where a Level 1 (L1) process flow would show an entire end-to-end process at a high level in seven to ten steps. The steps in an L1 process flow are decomposed into the next level of processes that the user would perform and represented as Level 2 (L2) process flows. Process flows might be created as both as-is and to-be representations of the business processes so that the changes or enhancements to current solutions can be shown visually. The process flows might be accompanied by additional details to ensure that stakeholders can understand what occurs with each step.
- Value stream maps are a variation of process flows. In addition to information in a traditional process flow, a value stream map shows any delays, queues, or handoffs that occur during the process. The purpose of a value stream map is to identify any time spent in the process that does not add value so it can be streamlined.
- Activity diagrams are another version of process flows that can be used for general workflow modeling, but commonly are used to visually show the complex flow of use cases. They are similar to process flows in syntax, but they commonly show user and system interactions in one diagram and mirror the textual description of use cases.
- Sequence diagrams are another model that describes how user or system processes interact with one another across any involved users or systems and the order in which the processes or steps are performed. Sequence diagrams are most useful for communicating with technical teams about the flow of information between systems, the delegation of functionality to where it will be performed, and the flow of control from step to step. They are particularly helpful in determining which business objects are needed by showing where the information flows.
- Process flows can be created to show how programs or projects can improve processes before projects start and are also created after a project has begun, and continue to be created as product information is progressively elaborated.
4.10.2 Purpose of Models
- Business analysis models are helpful to find gaps in information and to identify extraneous information. Models provide context to better understand and more clearly convey information. Requirements are modeled and refined to achieve further clarity, correctness, and to elicit additional information to define the details necessary for the product to be built.
- When the correct models are applied, analysis becomes simple relative to analyzing the information in pure text form, because the models help visualize and summarize complex information. When the correct models are applied, analysis becomes much easier.
- Models provide a visual element to text-based requirements which portray the requirements in various forms for understanding. There are models to depict scope, process, rules, data, and interfaces.
Product information
- Product information types include:
- Business goals and objectives
- Requirements
- Analysis models
- Backlogs
- User stories
- Acceptance criteria and definition of associated metrics
- Product scope
- Product risks
- Assumptions
- Constraints
- Dependencies
- Issues
- Product information can include different types or levels of detail. For example, requirements could refer to business requirements or stakeholder requirements, and issues might be stakeholder issues or defects. Product information can take on different states as various processes consume and produce the information. For example, at different points in business analysis work, requirements can be in a verified, validated, prioritized, or approved state. The product information may be stored in a variety of forms, such as tools, documents, notes, emails, and possibly in people’s minds.
- Data dictionary is a tabular format and shows data fields and attributes of those fields. Common attributes include name, description, size, and validation rules. However, any relevant attributes can be captured in a data dictionary.
- Types of questions: open-ended, closed-ended, contextual, and context-free questions.
Estimation techniques:
- Affinity estimating (relative estimation, T-shiring sizing)
- Bottom-up estimating
- Delphi
- Estimation poker
- Relative estimation
- Wide-Band Delphi
Planning techniques:
- Product backlog
- Rolling wave planning
- Story mapping
- WBS
Elicitation
- Brainstorming
- Collaborative games
- Product box
- Speedboat
- Spider web
- Document analysis
- Facilitated workshops
- Focus groups
- Interviews
- Structured vs. Unstructured interviews
- Synchronous vs. Asynchronous interviews
- Observation
- Passive observation
- Active observation
- Participatory observation
- Simulation
- Prototyping
- Storyboarding
- Wireframes
- Evolutionary
- Low-fidelity prototype
- Wireframes
- Mockups of interface screens or reports
- Architectural renderings of a building
- Floor plans
- Sketches of a new product
- Any design that is evolving
- High-fidelity prototyping
- Throwaway prototypes
- Evolutionary prototype
- Questionnaires and surveys
Prioritization Schemes:
- Buy a feature
- Delphi
- MVP (Minimum Viable Product)
- MoSCoW (Must, Should, Could, Won’t)
- Multivoting
- Purpose alignment model (critical vs. competitive advantage)
- Time-boxing
- Weighted ranking
- Weighted shortest job first (WSJF)
- Technical debt is the accumulated workarounds and shortcuts built in to software during development that make it difficult to support and enhance.
- Modeling elaboration is a technique that uses the collection of models together to further identify gaps, inconsistencies, or redundancies in product information. The requirements architecture, as defined in the analysis approach, will help determine which models are best to use together. Models can be collectively used to help complete one another. For example, a model that shows the steps people take to perform a task, like process flows, can be compared to organizational charts to ensure that all stakeholders are covered in some process flow and all people who perform steps are covered in organizational charts.
- Functional managers and subject matter experts (SMEs) participate in validation activities because they will understand if the requirements meet the business goals or objectives and whether the requirements as stated present a true picture of what needs to be built.
- Risk Spike. A sprint or iteration specifically designated for research to address product risks
- Spike. A short time interval within a project, usually of fixed length, during which a team conducts research or prototypes an aspect of a solution to prove its viability.
- Requirements relationships:
- Subset
- Implementation dependency
- Benefit or value dependency
- In adaptive: Typically establishes linkages between user stories and acceptance criteria. Might trace to objectives. Epics or user stories may be traced to features and acceptance tests. Any components of product information might trace forward to design and test and ultimately to the solution. Performed iteratively via story slicing or story mapping as new items are added to the product backlog. May be forms of direct tracing such as attaching a visual model to a story or linking user stories and acceptance criteria.
- Analytical skills
- Creative thinking
- Conceptual and detailed thinking
- Decision making
- Design thinking
- Numeracy
- Problem solving
- Research skills
- Resourcefulness
- Systems thinking
- Expert judgment
- Enterprise/organizational knowledge
- Business acumen
- Industry knowledge
- Life cycle knowledge
- Political and cultural awareness
- Product knowledge
- Standards
- Communication skills
- Active listening
- Communication tailoring
- Facilitation
- Nonverbal and verbal communication
- Visual communication skills
- Professional writing
- Relationship building
- Personal skills
- Adaptability
- Ethics
- Learner
- Multitasking
- Objectivity
- Self-awareness
- Time management
- Work ethic
- Leadership skills
- Change agent skills
- Negotiation skills
- Personal development skills
- Skills to enable one to become a trusted advisor
- Tool knowledge
- Communication and collaboration tools
- Desktop tools
- Reporting and analysis tools
- Requirements management tools
- Modeling tools
- Story slicing is a technique used to split requirements or user stories from a higher level to a lower level. Story slicing is a means of establishing relationships between requirements as lower-level requirements or user stories are subsets of higher-level requirements or epics.
Configuration management
- Configuration management pertains to managing changes to the solution being built, while change control pertains to managing changes to the project documents, deliverables, or baselines.
- Configuration management helps to ensure the product or service being built conforms to its approved requirements. It provides a process to verify this conformance, document changes, and report the status of each change throughout the project life cycle. It includes documentation, a tracking process, and defined approval levels necessary for authorizing changes. It enables managing changes to aspects of a product in the context of the entire product as well as the context of other products on which it depends or which depend upon it.
- Configuration management for business analysis ensures that
- (a) the requirements and requirement-related documents, such as, models, traceability matrix, and issues list, are stored where they can be easily accessed by project stakeholders and are safeguarded from loss; and
- (b) access to previous versions of documents is available, when needed.
- A business analyst may achieve these objectives with a CMS, a requirements management repository, or with a wiki platform. When using less formal tooling, such as a wiki, the CM goals will not be achieved without a process on how and when to access and write to the wiki. The process for storing requirements-related information and the tools to support the project needs are determined and agreed upon in business analysis planning.
- It is the responsibility of the BA to sustain stakeholder engagement throughout the business analysis processes, including those related to change.
- In adaptive approaches, iteration planning, or sprint planning, is the activity used to identify the subset of product backlog items from the product backlog that the development team will work on for the current iteration or sprint. Because the results of iteration planning provide the backlog items that will be considered the planned work for the current or next iteration, these items can be interpreted as approved.
- The mindset inherent in traceability and monitoring that concerns relationships between requirements, other product information, and project considerations, such as test cases and releases, is applicable on all projects and all life cycles, regardless of how they are captured.
- Relationships and dependencies are the linkages established between objects, such as components of product information, deliverables, and project work.
- In adaptive life cycles, this information is used when prioritizing the backlog, as a newly added backlog item may have linkages to other items in the backlog and these may be grouped and prioritized together. In predictive approaches, relationships and dependencies can be used to identify other impacted backlog items to size up the impact of making a change.
- In a predictive life cycle, relationships and dependencies decrease the probability of missing requirements, support impact analysis, and help the team maintain scope.
- Requirements walkthroughs are used to review the requirements with the stakeholders and to receive confirmation that the requirements as stated are valid. Valid requirements accurately reflect what the stakeholders are asking the solution developers to develop.
- To conduct a requirements walkthrough, the business analyst schedules the session providing the stakeholders enough time to prepare. Reviewers may be asked to read the materials before attending and, by doing so, the reviewers will be able to:
- Think about the stated solution ahead of time, better preparing their feedback,
- Avoid providing emotional reactions to the material in the session, and
- Take time to discuss the materials with their organizational units and peers so that feedback provided is representative of the larger stakeholder group.
- The flow of information in a review session should come from the reviewers as much as possible. This session is one of the final opportunities for the stakeholders to raise questions, seek clarity, and voice concerns. The business analyst can use this session as an opportunity to field questions and seek to close down any open requirements- related issues in preparation for receiving final approval of the requirements
- Requirements are baselined when they are selected for the next iteration and then changed only if the team agrees to make a change or the product owner cancels the story or iteration.
- Inspection. A formal and rigorous form of review in which practitioners close to the work (usually other business analysts, developers, test team members, or quality team members) inspect the work for completeness, consistency, and conformance to internal and external standards, often referring to a checklist. The inspector uses the checklist and the inspection process to review a set of requirements and provide feedback to the authoring business analyst.
Solution Evaluation
- Evaluating solution performance involves determining whether a solution or solution component that has been put into operation is delivering the desired business value. The actual business value of a solution is measured in terms of the business goals or objectives. Business analysis also assesses the underlying reasons behind the results obtained.
- Evaluation of solution performance typically occurs after a solution has been released. Therefore, it is more likely that the evaluation of solution performance will occur during portfolio or program activities rather than project activities. The extent to which business value has been achieved and the reasons for the achievement are significant factors to consider when making product decisions within a portfolio or program. However, Evaluate Solution Performance not only supports product decisions within a program or portfolio, but also may be used during a project at any time when solution evaluation can provide insights.
- Solution Evaluation happens when a go/no-go decision is pending, shortly after a solution or solution component has been released, or sometimes long after a solution has been put into operation
Evaluation activities may occur:
- At any point when a go/no-go or release decision needs to be made for a solution or a substantive segment of it;
- During a short-term period after a solution or segment is put into operation, such as after a warranty period; or
- Well after a solution is put into operation, to obtain a long-term perspective about whether the business goals and objectives for the solution were met and whether the value expected continues to be delivered.
- After a solution is launched, performance data are used to compare business value to what was expected. Subjective and objective evidence is collected. Root causes are identified for deviations from what was expected. Recommendations may be made to address reducing the deviations. Root causes become input into decisions to enhance, maintain, replace, or discontinue the product.
- Once the solution is launched, data about the business value delivered will be collected and compared to what was expected, regardless of whether an adaptive or predictive approach is used.
- A situation statement describes the problem or opportunity and its effect on the organization. The wording of the situation statement may suggest ways to measure whether or not the problem or opportunity has been addressed. The situation statement might also be used to determine how, when, and how frequently a solution should be evaluated.
- Early identification of evaluation criteria can provide input into test plans and test cases, and it can be used to confirm solution requirements.
- Business analysts collaborate with several roles when obtaining solution acceptance for a release.
- For formal solution acceptance approaches, a release management organization might be responsible for coordinating all release - related activities, including obtaining solution acceptance.
- In many organizations, someone in a project management role is typically accountable to obtain the sign-off.
- Operational managers may confirm that all business transition considerations have been sufficiently addressed and that they are comfortable with the solution and any workarounds associated with it.
- Quality control may be consulted to confirm that all product testing concerns have been sufficiently addressed, and
- architects and designers may be consulted to confirm that technical product concerns have been sufficiently addressed.
- For informal solution acceptance, project teams may make the release decision part of a demo and feedback process in collaboration with other product team members in participation.
- For formal solution acceptance approaches, a release management organization might be responsible for coordinating all release - related activities, including obtaining solution acceptance.
- Confirm Expected Values for Software Solutions: For automated solutions, it is essential to validate functionality that manipulates data by using the solution’s data retrieval functionality. However, the sufficiency of the solution also needs to be evaluated by confirming that the actual data is accurately stored, because that data may potentially be retrieved in other ways for other users and uses.
- A decision to release a solution to its operational area requires confirmation of the completion of any warranty period that may have been established. A warranty period is an interval of time during which the product development team is responsible for addressing any defects found after the solution is released for production.
- Business analysts assess the impacts of failed tests to determine root case and severity of impact on the go/no-go decision.
- This distinction supports common practice in the industry, where organizations distinguish between roles that conduct business analysis and roles that perform testing. The pass/fail aspect of comparing actual results from acceptance testing to testing criteria is typically a task within the testing discipline. Business analysis is then needed to consider the magnitude and severity of the defects, to determine their root cause, to identify risks associated with them, and to identify and recommend ways to address them. As part of those recommendations, business analysis can consider the business impacts and costs incurred by repairing or working around the defects, along with potential business impacts and costs of deploying the solution without addressing the defects.